Deep Detection Dreams: Enhancing Visualization Tools for Single Stage Object Detectors

Authors: Christian Limberg, Augustin Harter, Andrew Melnik, Helge Ritter, Helmut Prendinger

Abstract

This article introduces the DeepDream approach for object detection, which allows us to visualize how objects are represented in single stage object detector networks like YOLO. Such networks work by predicting objects for thousands of fixed image positions in parallel which makes them even more opaque compared to classification CNNs. While there has been much work on feature visualization for classification, this study examines how visualization methods can deal with the multitude of possible object positions in detection tasks and investigates the necessary adaptions of the DeepDream method. Our experiments suggest that YOLO detects objects relative to the scene composition. YOLO does not only recognize single objects but it also has a clear representation of scene context, object sub-types, positions, and orientations. We visualize our findings with interactive, web-based demo applications, which are available on our webpage. This research broadens the understanding of how objects are represented in object detection networks.

Figure 1: YOLOs Intermediate Grid Cell Detections

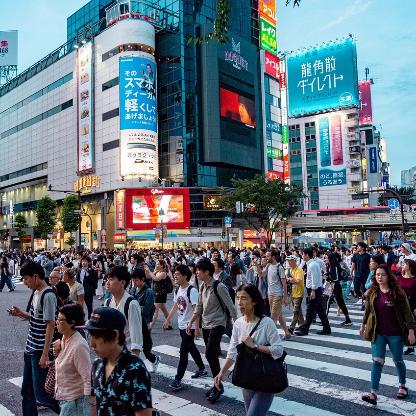
With our interactive visualization, you can explore the three different output grids of the YOLO network for multiple images. The YOLO architecture incorporates three distinct pathways to identify objects of varying sizes. The recognition heads are situated within 2D grids of different resolutions. Each grid element estimates the x- and y-position, width, height, confidence value, and probability vector of an underlying object (if there is any). The predicted class and confidence value are labeled on the bounding boxes. Object proposals with high confidence are highlighted in blue. By the top bars, the pathway and the input image to be visualized can be selected. By hovering over the figure, the respective grid cell and the detected bounding box of the most certain anchor box is visualized.

Figure 2: Grid Cells and their Confidences

By placing the actual input image below the grid cells, it becomes evident how the confidences of the anchor boxes are shifted, with high confidence anchor boxes highlighted in blue. This visualization also reveals how neighboring grid cells become activated in the process. By the top button rows, the pathway and the input image to be visualized can be selected. By hovering over the figure, the input image is shifted.

Figure 3: Video of Optimization Process

We have created a video that demonstrates the optimization process of several classes from the COCO dataset using our proposed Deep Detection Dream approach.

Figure 4: Optimizing for Specific Height

By our proposed detection dream approach, we can generate objects with specific attributes like in this case an adjustable height. By dragging the slider below the image, the object of class person is adjusted for having a height from 10% to 100% of the image height.

Figure 5: Optimizing for Specific Spatial Position

With our proposed \enquote{Deep Detection Dream} approach, we have the capability to generate objects within specific spatial image regions.

Figure 6: Workflow for Deep Detection Dream Approach with Donor Images

The DeepDetectionDream (D3) approach consists of two phases. In the first phase (1), bounding box information BB_d is extracted from a donor image using YOLOX. In the second phase (2), D3 is utilized to optimize a gray image such that its bounding box output BB_o matches BB_d. Download figure

Figure 7: Visualization of Different Hyperparameter Settings

Ratio
Learning Rate
Amplification
A change in hyperparameters have different effects. The Ratio hyperparameter describes a ratio of mean square error of bounding box outputs and total variation loss. If total variation loss is setup to a higher ratio, simpler forms are generated. If the parameter is too low, however, high-frequency noise is generated. The second slider selects the learning rate of gradient descent. The third selects the amplification rate of the multiplier mask.

Figure 8: Video of Donor Image Optimization Process

Video of reconstructing several images just by their objects' bounding box representations.

Figure 9: Donor Image Optimization Results

Several reconstructed images with and without the predicted bounding boxes. Select an image from the upper film roll to see its optimization image. Bounding boxes of both images estimated by YOLOX can be visualized by checking the corresponding checkbox under the image.

Cite Us

This article needs to get accepted first, before a reference will spawn here.